
Before we get to the point, let me ask you a quick question. If you pull the necklace, where will it break?
The answer is simple. This is where the wire is damaged or thin, the “weakest point.” So if you strengthen its weakest point, the necklace will be stronger.
So next question. Suppose you strengthen the weakest point, confirm that it no longer breaks when you pull it, and then pull the necklace again. Well, where will you cut this time?
You understand. The answer is ‘the next weak point is cut’. Essentially, the necklace breaks at its “weakest point” when pulled.

If you pull on the necklace, it will break at its weakest point. Applying this to an organization…?
Now let’s consider the example of an assembly machine in a factory.
As shown in the figure below, we are trying to make a finished product by passing parts in order from assembly machine A → B → C from the left side of the assembly line. The production capacity of assembly machines is A: 50 units, B: 20 units, and C: 40 units per hour. Now, how many finished products can this assembly machine produce per hour?
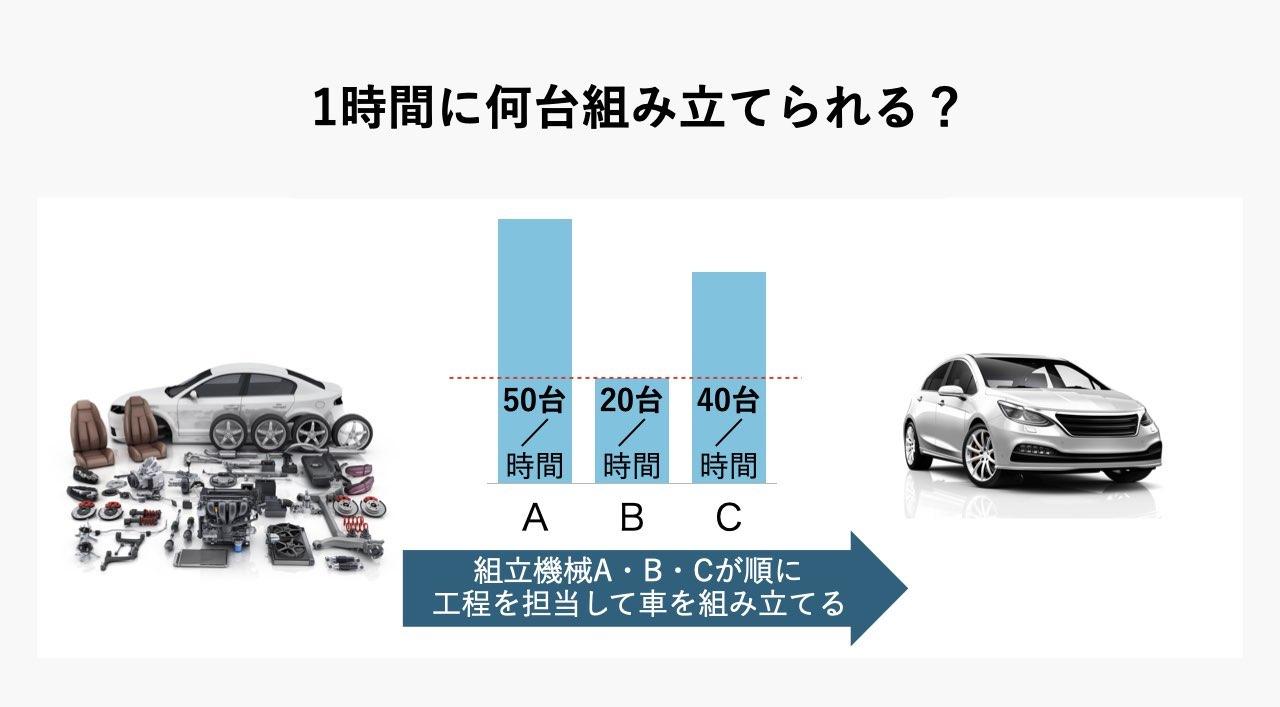
Three assembly machines with different production capacities. How many finished products can be made in one hour?
The answer is 20 units.
Assembly machine A has a production capacity of 50 units per hour and C has a production capacity of 40 units. But B has a production capacity of only 20 units per hour. This assembly machine B becomes the “weakest point” in the process and determines the overall productivity.
This is the “constraint condition theory” advocated by Professor Eliyahu Goldratt, who is famous for his best-selling book “The Goal”..
The “weakest point” in the previous necklace example and the “weakest point” in this assembly machine example are called “constraints.” The amount of output is affected by this constraint.
ThereforeTo increase the amount of output, keep strengthening the “weak points” that appear one after another, that means. By doing so, the necklace will not break even if it is pulled, and the number of finished products that the assembly machine can produce per hour will increase.
As an aside, “The Goal” was originally a best-seller in the United States, but for the next 17 years, the author, Professor Goldratt, did not approve the translation into Japanese, which is an exceptional book.
Why didn’t you allow the translation? “Japanese people are world-class when it comes to improving partial optimization. There will be chaos,” thought Professor Goldratt.
I came across this book in 2001, right after the Japanese version was published. I was shocked when I read the contents, and immediately tried to be conscious of this constraint theory in my own work.
Then, to my surprise, I was able to make decisions based on “total optimization” and improve the productivity of my work. Since then, I have used constraint theory in various situations, not only during my tenure at Recruit, but also after going independent.
How to increase the productivity of the assembly line?
I knew where my “weakest spot” was. So what can we do to improve overall productivity?
Now let’s get back to the topic and think a little more specifically about what we can do to increase the productivity of the assembly line.
If you want to increase the hourly productivity of the assembly line from 20 to 35, there is no need to modify assembly machines A and C. It means that you should raise it to 35 per hit.
For example, if an old model assembly machine that can only make 15 units per hour is sleeping in a warehouse, it is possible to pull it out and run it in parallel, creating 20 new models + 15 old models = 35 finished products. comes out.
So, what should workers who work on assembly machines do? If you were the factory manager, which of the following three options would you choose?
- Hire new workers to increase the number of workers for assembly machine B
- Have the existing workers of assembly machine B work hard
- Transfer the workers of assembly machines A and C
Option 2 may be what many organizations tend to do. However, this would inevitably lead to worker exhaustion.
Different assumptions will of course lead to different answers. However, hiring a new employee (Option 1) will increase recruitment costs and increase personnel costs. The cost required for training cannot be ignored.
So, should we let the existing workers do their best without incurring additional costs (Option 2)? Of course, there may be such an option for a while. In practice, this may be the most popular choice.
However, if workers continue to push themselves too hard, they may become unwell, or if they get worse, they may quit. Unreasonable measures will not last long. This makes the “constraint” even weaker.
Therefore, according to the “Constraints Theory”, the appropriate answer is “I want the workers of assembly machines A and C to be transferred.”
In general, organizations often allocate personnel according to the production capacity of assembly machines. Although workers who can assemble 50 and 40 machines are assigned to assembly machines A and C respectively, the target number is only 35 machines. This means that there are surplus personnel.
By supporting assembly machine B, which has the lowest production capacity, with A and C, which are not constraints, B’s productivity can be enhanced.
Now, with reference to the examples so far, let’s find the “constraint = weakest point” in your organization and think about how to strengthen it. If you follow the Constraint Theory, your organization will become stronger in no time.
How to find the weakest point in an organization
In Constraint Theory, first and foremost, it is important to identify the “weakest point”. Here are two ways to find the weakest link in your organization.
The first method is to refer to the assembly line and express the business model with arrows. The figure below shows an example of sales activities. From left to right, sales activities are carried out in the following steps: Listing → Approach → Hearing → Presentation → Closing → Delivery → Collecting sales.
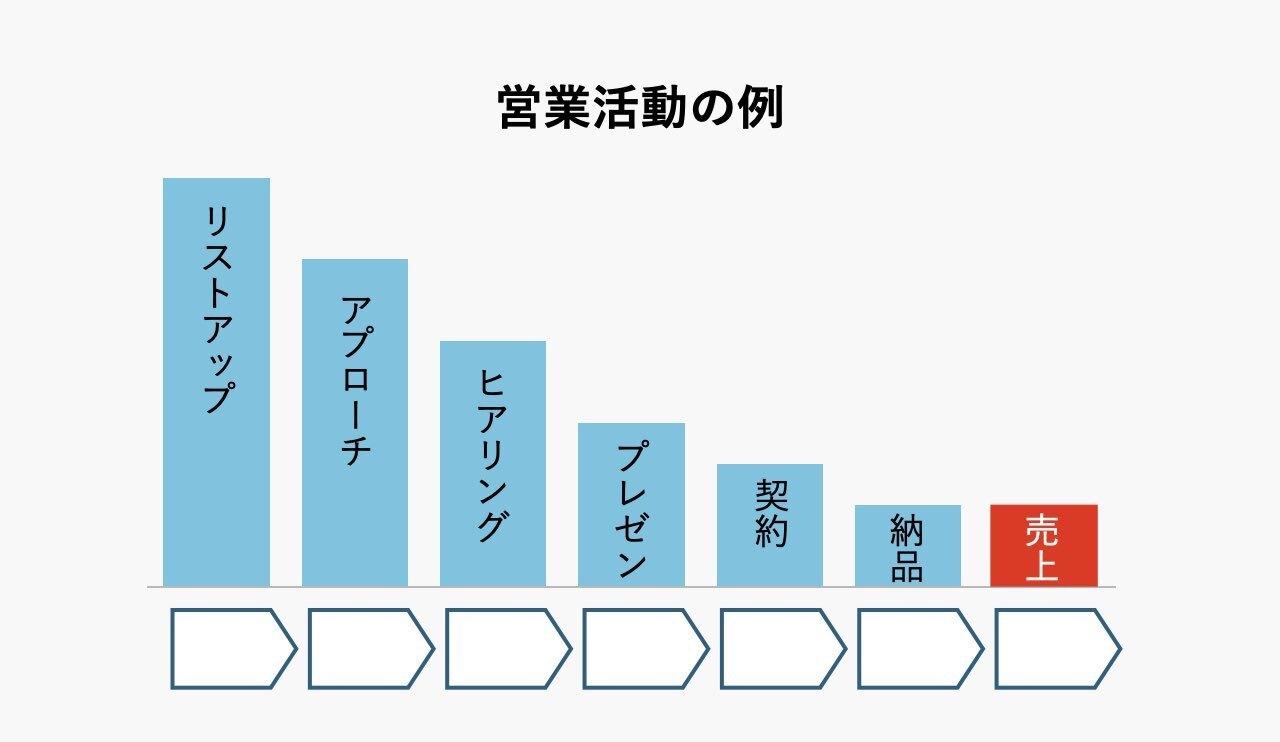
Break down your organization’s business model by activity.
How many cases were listed, how many were approached, and how many were advanced to the next hearing. At this time, if you know the industry average value, you should compare it with it. If you don’t know, grasp the overall figures of your company so that you can compare between departments, such as sales departments 1, 2, 3, and 4.
After roughly grasping the situation with these figures, we will compare other departments with reference to the figures of the department with the highest yield (high performer).
At this timeThe trick is to compare the average departments (middle performers) rather than the departments with poor yields (low performers).is. This is because low performers may be influenced by special factors, which may introduce noise (error) into the analysis.
In this way, in the process of thoroughly comparing the differences between high performers and middle performers, departments with poor yields become candidates for constraint conditions.
Here’s an example of a yakiniku chain that used this method to expose its “weakest link.”

I want to increase sales with the hook of seaweed soup, which is the pride of the yakiniku restaurant. How did the sales of middle/low performers who learned the methods of high performers change?
Among the member stores of this yakiniku chain, there was a store manager who thought, “Let’s increase sales by introducing additional seaweed soup.”
The wakame seaweed soup at this restaurant is not only very delicious, but it also refreshes your mouth when you drink it. Moreover, if the cost of seaweed soup is low and the profit margin is high, there is no reason not to introduce it to customers.
However, when we tried to expand this initiative to all stores in the chain, we found that while high performers received almost 100% additional orders for wakame soup, middle performers only received around 50%, and low performers about 20%. I found that the yield varies greatly depending on the staff. What is the difference?
Therefore, we thoroughly compared the efforts of high performers and middle performers.
At first, I thought that middle performers were not as thorough in their approach to customers as high performers, but that was not the case. Middle performers were also recommending seaweed soup to all customers. Then, what was different was the “content” of the voice, in other words, how to guide the seaweed soup.
The middle performer asked the customer, “Would you like our specialty seaweed soup?” In response to this, the high performers said, “Would you like our signature seaweed soup? Would you like it large or small?”
In other words, middle performers made “yes or no” suggestions, while high performers made “big or small” choices. This is the weakest point for middle performers.
Therefore, referring to the voices of high performers, we standardized the method of suggesting wakame soup at all chain stores to “large or small”. As a result, the rate at which middle performers can obtain additional orders has jumped to around 90%, and the number of additional orders for meat has also increased. In this way, each store succeeded in increasing sales and profits.
How to find organizational constraints
Now, I would like to introduce a second method for finding constraints in an organization.
Consider the necklace example I mentioned earlier. Pulling on the necklace and breaking it was the “weakest point.” Let’s apply this to how we find constraints in an organization.
As before, we will draw the business process as arrow feathers. Next, fill in the information of the members responsible for each process. Well, what kind of attribute is the person in charge of that section? Where are the constraints in that?
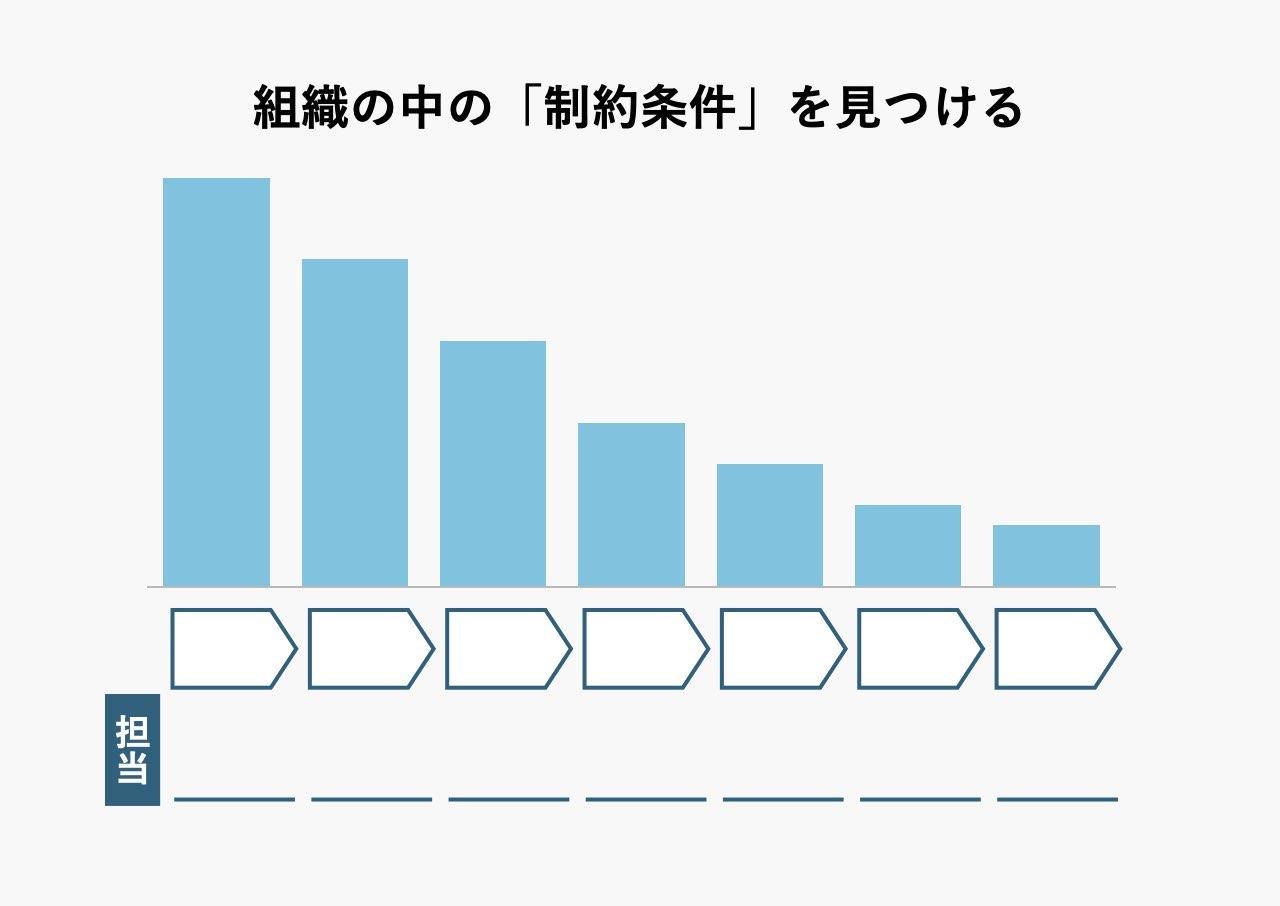
Write down your organization’s business processes. Who is in charge of each activity and what are the constraints?
By organizing the information in this way, it is often possible to visualize that “weak people” and “departments where many weak people belong” are constraining conditions. When it comes to who is the “weak person” in an organization, the following three are mainly assumed.
What is a weak person in an organization?
- Inexperienced people in the organization: new hires, transferees, career changers
- People with weak employment status: contract employees, temporary employees, outsourcing
- People with lower positions: Members
Conversely, what is a strong person in an organization——
- People with long experience in the organization: existing members
- People with strong employment status: full-time employees
- High-ranking people: managers, managers
In other words, according to the theory of constraints, you can strengthen the entire organization by protecting departments that have “weak people.”
As a possible measure, for example, the following measures are given to departments that are constrained.
- Actively transfer “strong people” from within
- provide training
- Set low sales targets and get success experience, etc.
Most companies tend to do just the opposite. Transferring stronger people to stronger departments and providing them with education… is actually a decision that goes against the Constraints Theory.
In fact, if you look closely at organizations with good performance, you can say that there are many cases where they make decisions according to this theory of constraints.
As an aside, in 2019, Robert Keegan and Lisa Raskow Lahey’s “Why are organizations strong when they can show their weaknesses” became a hot topic. In their book, Keegan and Lahey argue that organizations that have an environment that can be described as “weak” or “challenged,” as well as an environment that supports their people and departments, are the most successful as a result. That’s exactly what “Constraints Theory” teaches.
So far, I’ve talked about the logic of finding “constraints” and strengthening them to improve organizational performance. So, next time, I will introduce the procedure for specifically improving performance using the theory of constraints.
*This article first appeared on April 24, 2020.
Ryuichiro Nakao:President of Nakao Management Institute. Completed Graduate School of Engineering, Osaka University in 1989. He joined Recruit. After serving as executive officer (in charge of business development) of Recruit Sumai Company, president of Recruit Technologies, and deputy director of Recruit Works Research Institute, he assumed his current position in 2019. He is also an outside director of Tabikobo, LIFULL, and ZUU, and a part-time auditor of LiNKX. His new book is “I tried to summarize 64 masterpieces of ‘really useful’ management in one volume”.
(Serialized logo design by Mio Hoshino, editing by Ayuko Tokiwa)
Source: BusinessInsider
Emma Warren is a well-known author and market analyst who writes for 24 news breaker. She is an expert in her field and her articles provide readers with insightful and informative analysis on the latest market trends and developments. With a keen understanding of the economy and a talent for explaining complex issues in an easy-to-understand manner, Emma’s writing is a must-read for anyone interested in staying up-to-date on the latest market news.